Contract Manager
GET A GRAPHICAL OVERVIEW OF THE PRICE INCREASE |
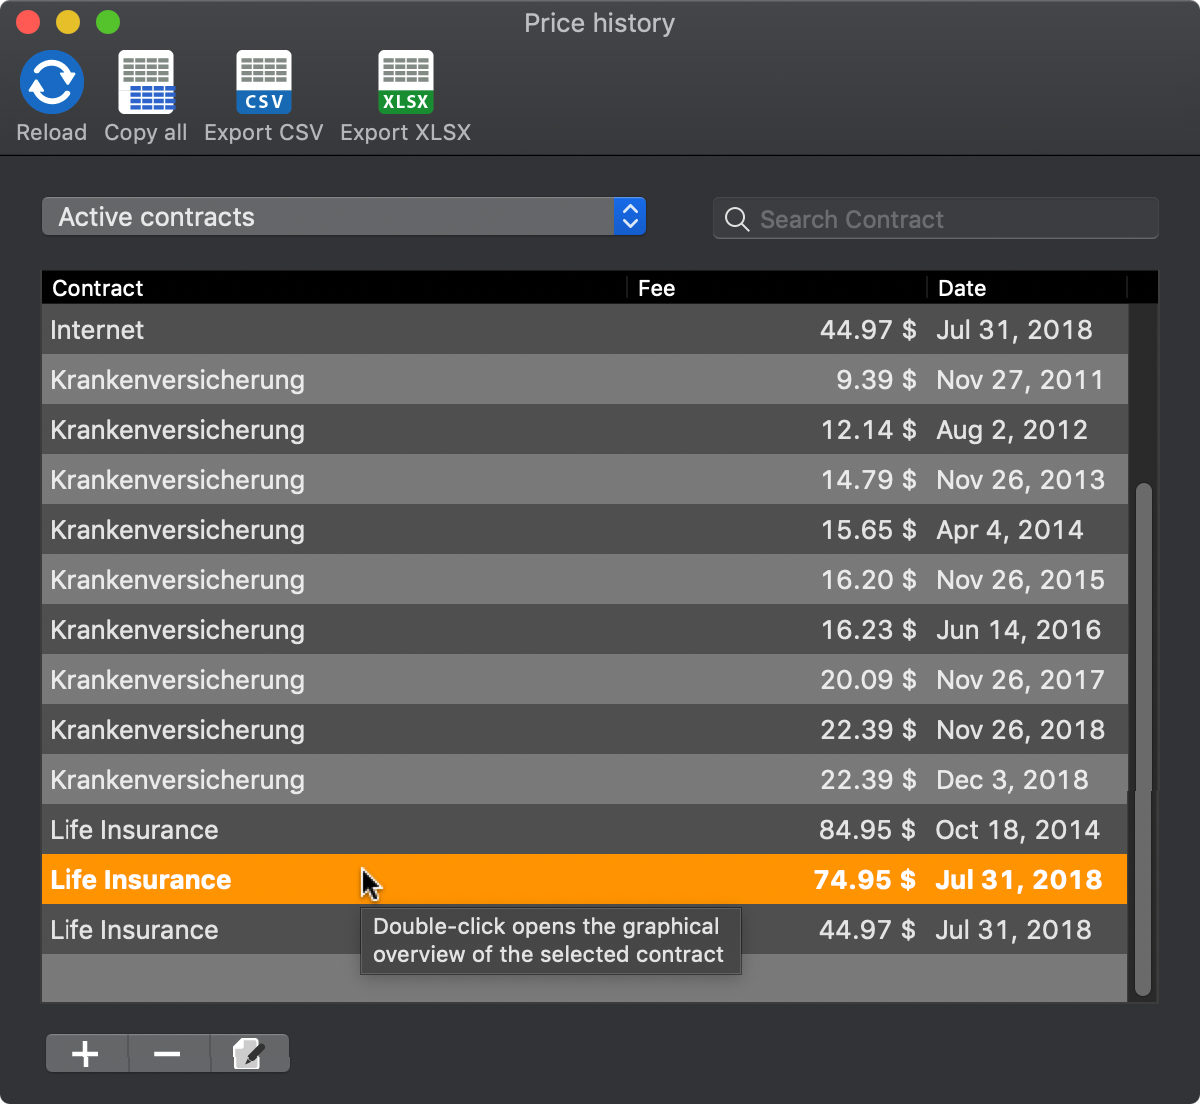
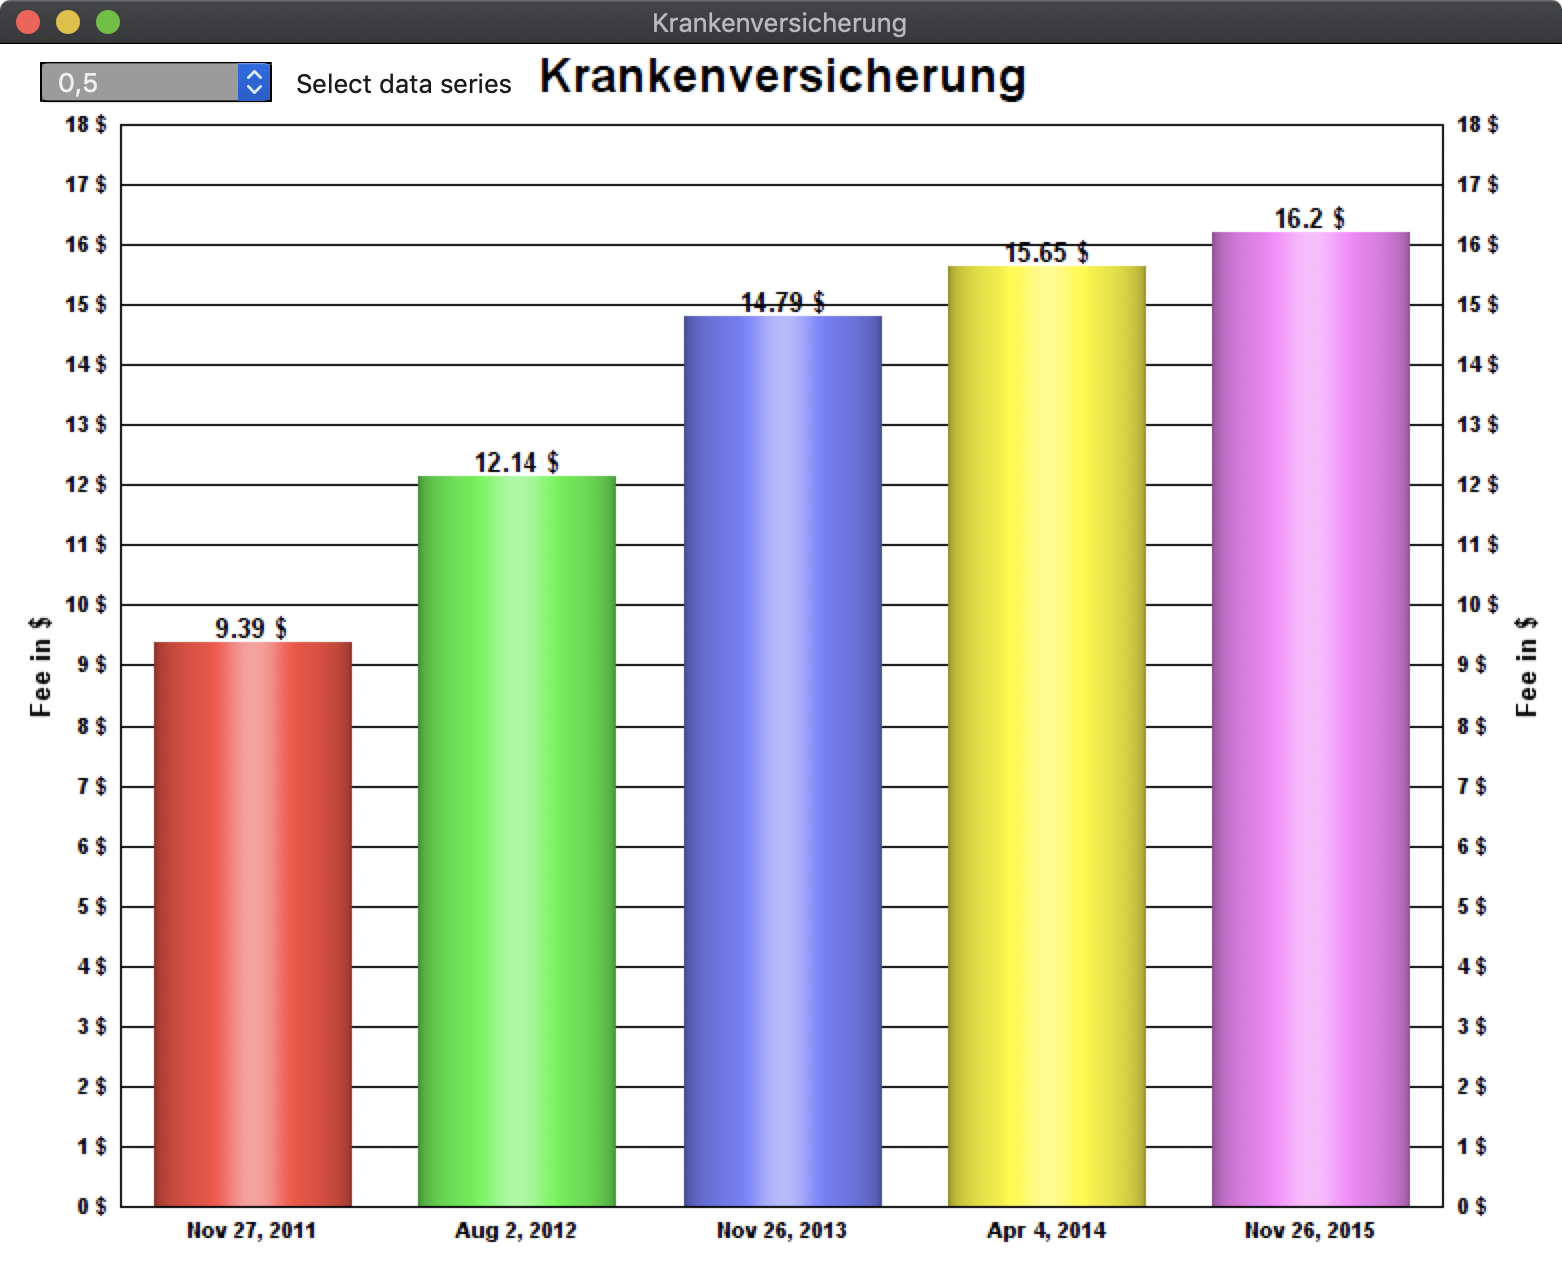
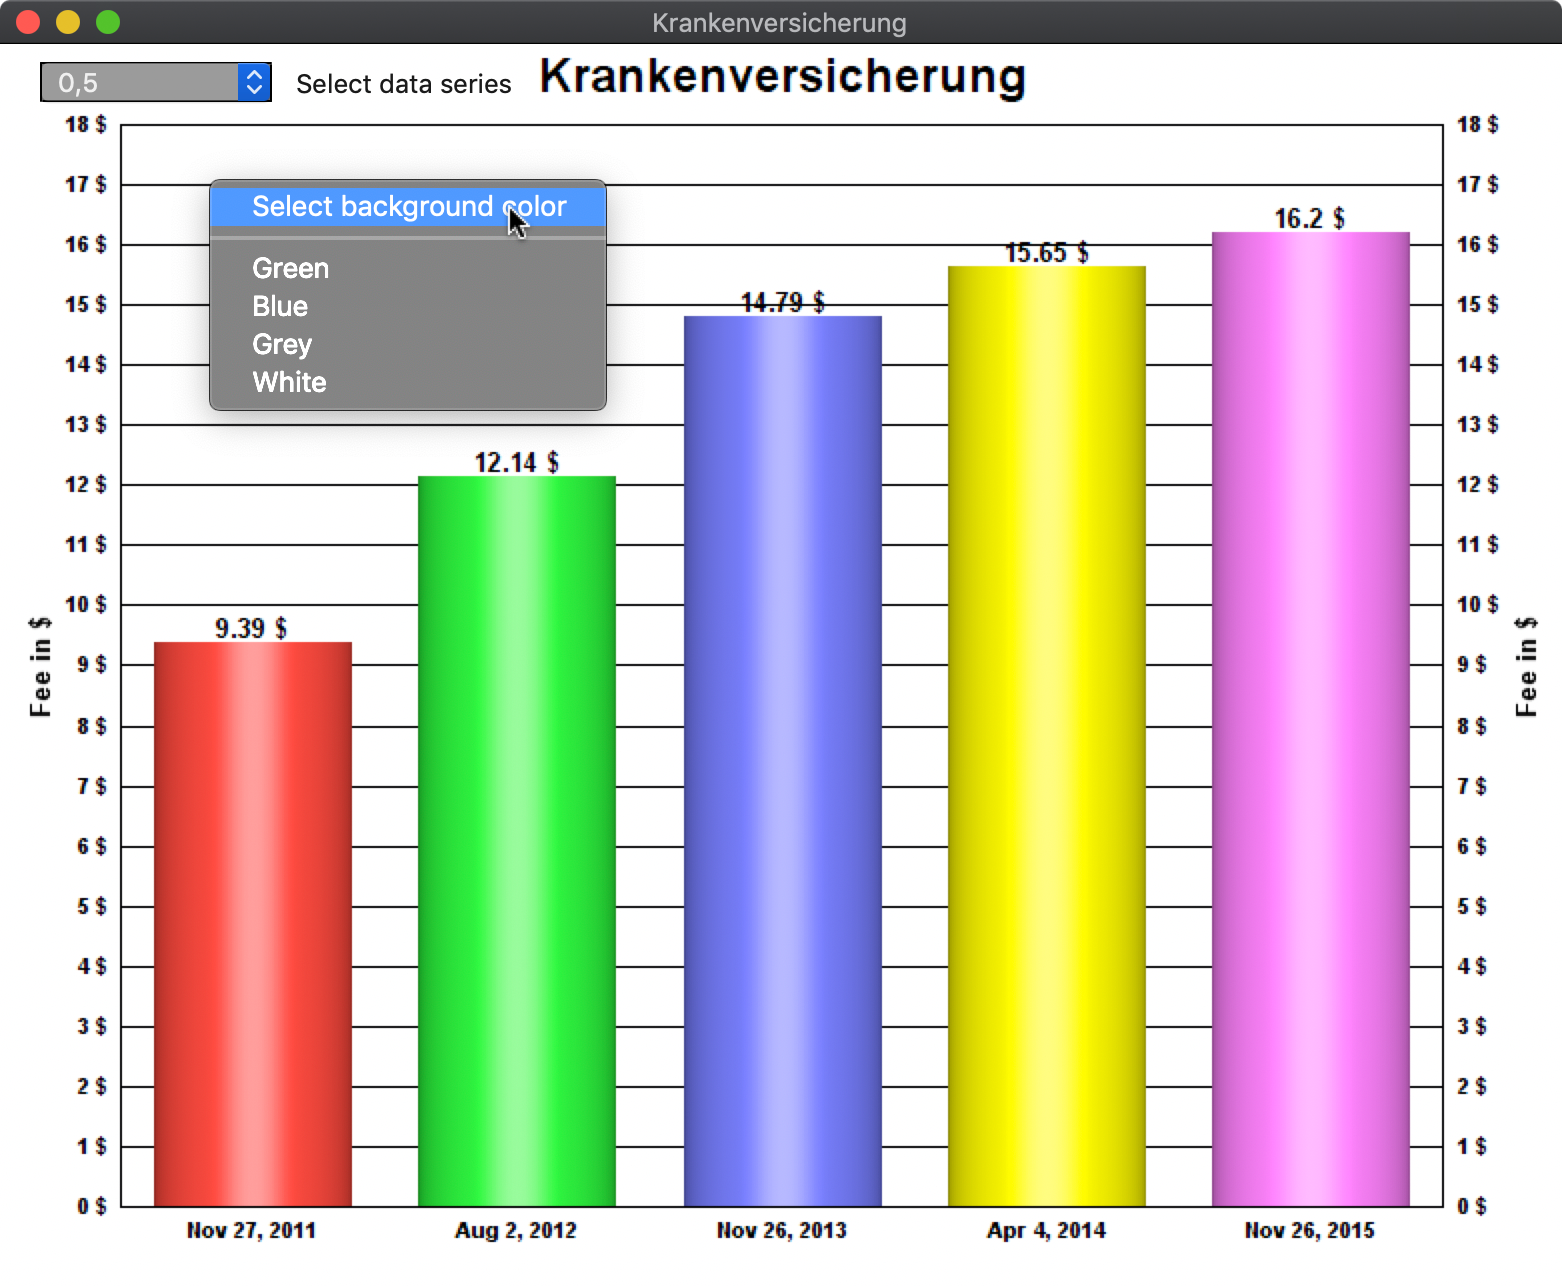
You can also look at the price increases of your contracts in a graphic. In the "Price History" window, select an entry with a double-click.
Depending on the size of the window, more or fewer records are displayed.
This happens in steps of 5, 10 and 15 records. Width of the window in pixels::
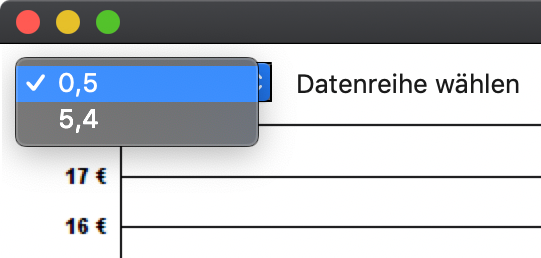
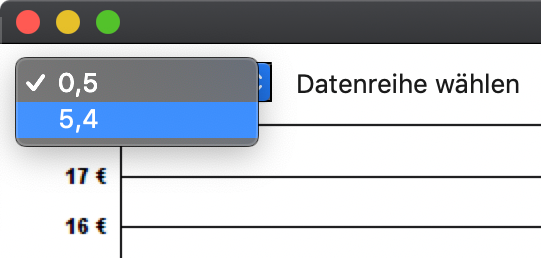
If there are more records than can be displayed at the moment, a pop-up menu will appear in the top left corner.
Here you can select the data series.
A different background color can be selected via the context menu.
You can set the default background color in the preferences. |
